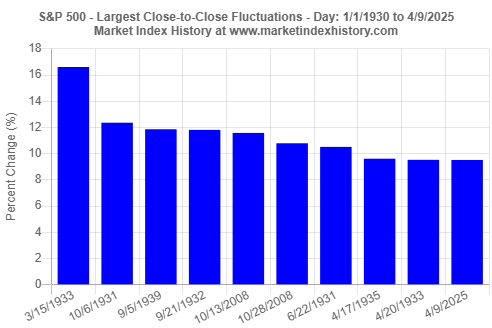
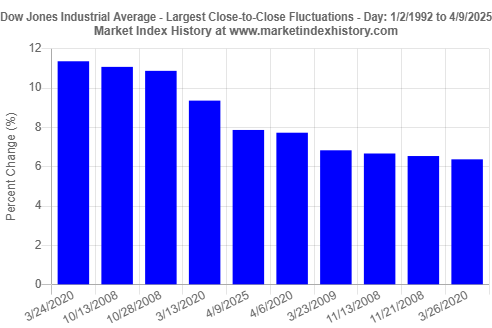
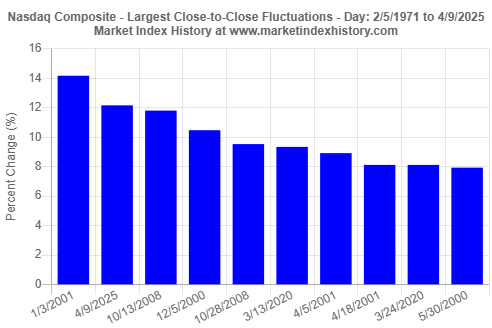
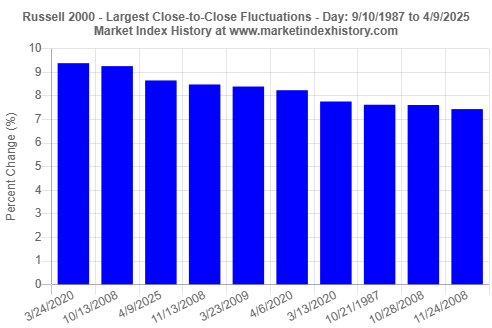
One day after we presented data for the S&P 500 having the worst April performance since 1932 (see article), the markets showed incredible rally today on the news that there would be a 90-day pause on tariffs to allow for negotiations between U.S. and trading partners. The announcement of the pause had an immediate and eye-popping impact on the U.S. markets. The S&P 500 gained 9.52%, Dow Jones Industrial Average added 7.87%, Nasdaq Composite index increased by 12.16%, and Russell 2000 grew by 8.66%. These large single-day gains cemented their place in market history. The S&P 500 gain is the tenth largest since 1930, Dow Jones Industrial Average gain is the fifth largest since 1992, Nasdaq Composite gain is the second largest since 1971, and Russell 2000 gain is the third largest since 1987. We have prepared four charts to show the largest single-day gains for the four major U.S. market indices.


U.S. Markets Show Incredible, Record-Level Rally - April 9, 2025

Please wait while we receive your comments...
We used our Largest Fluctuations in Market History analysis tool to examine the largest single-day gains for the S&P 500 index, Dow Jones Industrial Average, Nasdaq Composite index, and Russell 2000 index (Figures 1 to 4).
Go to S&P 500 Index chartGo to Dow Jones Industrial Average chart
Go to Nasdaq Composite Index chart
Go to Russell 2000 Index chart
S&P 500 Index

Dow Jones Industrial Average

Nasdaq Composite Index

Russell 2000 Index

Reminder
The gains today brought much needed relief and reassurance to institutional and retail investors. In spite of today's gains, it is important to remind our readers that year-to-date performance is still negative for all four major U.S. market indices. Year-to-date (to April 9), the S&P 500 is down 7.22%, Dow Jones Industrial Average is down 4.55%, Nasdaq Composite is down 11.32%, and Russell 2000 is down 14.21%. Feel free to use our Performance-to-Date in Market History analysis tool to see these observations for yourself.
To gain additional historical insights about market index performance, use any one of our Market Index Analysis tools. We use these analysis tools ourselves to gain insights into market performance and to highlight a variety of interesting observations in our historical insights articles.


