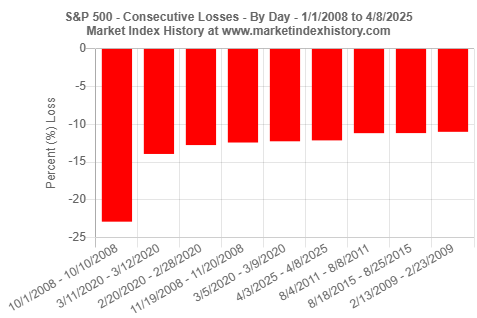
As of Tuesday, April 8, 2025, the S&P 500 index has exhibited by far its worst month-to-date performance for any April since 1932. Since the announcement of broad tariffs placed on U.S. trading partners, the S&P 500 index has recorded consecutive losses for the last four trading sessions, with cumulative losses of 12.14% from 4/3/2025 to 4/8/2025. The cumulative loss makes the top 10 list of consecutive daily losses since 2008.


S&P 500 Index Is Having Its Worst April Performance Since 1932 - April 8, 2025

Please wait while we receive your comments...
Investors have responded strongly to broad tariffs placed on U.S. trading partners, causing massive stock sell-offs, which have led to corresponding losses in market value in the trillions. Since the announcement of broad tariffs last week, the S&P 500 index has exhibited four consecutive days of losses from 4/3/2025 to 4/8/2025 (Figure 1).

The consecutive declines from 4/3/2025 to 4/8/2025 led to a cumulative loss of 12.1% in just four days (Figure 2). We remind our readers that a 10% reduction in a market index from its most recent peak places the index in correction territory. The most recent peak of the S&P 500 was 6,144.15, which was an all-time high record that was set on 2/19/2025 (see All-Time High Records in Market History). The close of market on 4/8/2025 was 4,982.77, 18.9% lower than the peak, approaching the 20% loss indicator of a bear market.

To place this most recent consecutive loss in a historical context, we used our Consecutive Gains and Losses in Market History analysis tool to see how this loss compares in magnitude to previous consecutive daily losses. Figure 2 shows that the cumulative loss of 12.14% observed from 4/3/2025 to 4/8/2025 is the sixth largest consecutive daily loss since 2008.
While we are not showing the data here, our Consecutive Gains and Losses in Market History analysis tool can be used to confirm similar observations for the Dow Jones Industrial Average, Nasdaq Composite index, and Russell 2000 index. As of 4/8/2025, the Dow Jones Industrial Average and Russell 2000 index have recorded consecutive losses for the last four trading sessions. From 4/3/2025 to 4/8/2025, cumulative losses were 10.85% for the Dow Jones Industrial Average and 13.92% for the Russell 2000 index. For each index, the cumulative loss makes the top 10 list of consecutive daily losses since 2008. For the Nasdaq Composite index, two consecutive daily losses were recorded for 4/3/2025 and 4/4/2025. Yet, the cumulative loss over two days still makes the top 10 list of consecutive daily losses since 2008.
Given these large losses this month, we wished to better understand how the S&P 500 index month-to-date performance in April 2025 compares to its performance in April of previous years. We used our Performance-to-Date in Market History analysis tool for this purpose. Figure 3 shows that month-to-date (to April 8), the S&P 500 index has lost 11.21%. This is the worst month-to-date performance for any April since 1932.

Summary
Historically, the S&P 500 index has had healthy returns in April. Figure 4 shows that based on a 30-year dataset, the S&P 500 has returned an average of +1.87% in April. The recent drivers of market performance may bring about a very different outcome for April 2025.

To gain additional historical insights about market index performance, use any one of our Market Index Analysis tools.


