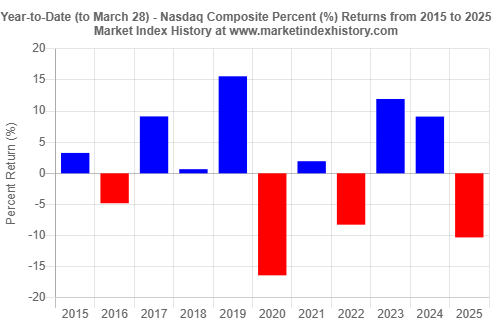
Massive stock sell-off on Friday, March 28, 2025 led to deepening 2025 losses for the S&P500 index, Dow Jones Industrial Average, Nasdaq Composite index, and the Russell 2000 index. Year to date (to March 28, 2025), the S&P 500 is down 5.1%, Dow Jones Industrial Average has lost 2.3%, Nasdaq Composite has shed 10.3%, and Russell 2000 has given back 9.3%. Red seems to be the prominent color for the first quarter of 2025 as all four major U.S. market indices have exhibited more days and weeks with negative returns than days and weeks with positive returns.


Further Stock Sell-Off Deepens 2025 Market Losses - March 28, 2025

Please wait while we receive your comments...
After a brief respite from losses last week, the U.S. stock markets continued their deepening losses this week. All four major U.S. market indices lost significant market value on Friday, March 28, 2025. The S&P 500 index was down 1.97%, Dow Jones Industrial Average lost 1.69%, Nasdaq Composite index gave back 2.70%, and Russell 2000 index shed 2.05%.
The losses on Friday led to negative returns for the trading week (March 24 - 28) for all four indices (Figures 1-4). Returns for the week were -1.53% for S&P 500, -0.96% for Dow Jones Industrial Average, -2.59% for Nasdaq Composite, and -1.64% for Russell 2000.


To better understand the performance of the indices so far in 2025, we used our Market Index Performance analysis tool to examine the weekly percent (%) returns of the four major U.S. market indices since the start of 2025 (Figures 1-4). After a week of gains last week, all four indices lost again this week. As we examine the weekly returns for the first quarter of 2025, it is clear that losses dominate gains for all four indices. All four major U.S. market indices have exhibited more days and weeks with negative returns than days and weeks with positive returns.
To further understand and quantify the losses incurred so far in 2025, we used our Performance-to-Date In Market History analysis tools to show where each market index stands at this point in time (March 28, 2025) compared to the same point in time in previous years going back to 2015 (Figures 5-8). As we noted previously, the losses observed so far for 2025 seem to resemble those we experienced in 2022, a year for which all four indices showed negative returns.


To gain additional historical insights about market index performance, use any one of our Market Index Analysis tools.


