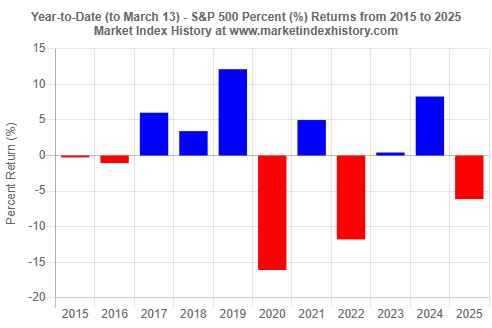
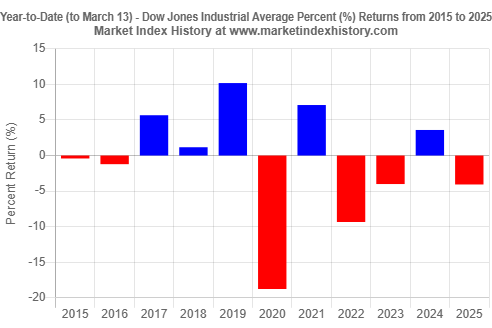
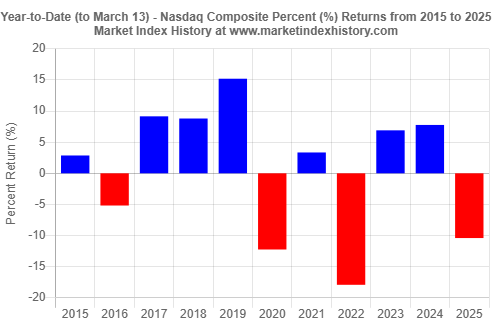
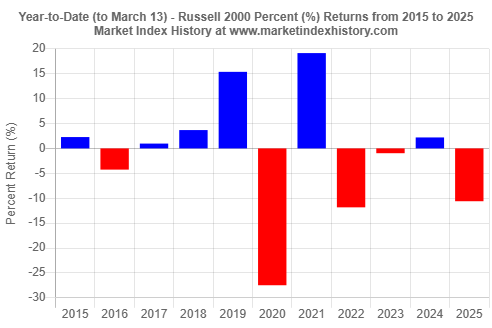
As of Thursday, March 13, 2025, the year-to-date performances of the four major U.S. stock market indices are beginning to look a lot like 2022, a year that exhibited negative returns. So far this year, the S&P 500 index is down 6.1%, Dow Jones Industrial Average is down 4.1%, Nasdaq Composite index is down 10.4%, and Russell 2000 index is down 10.6%. These trends are similar to those observed for 2022 at this point in time.


Year-to-Date Stock Market Performance Looks Like 2022, A Year of Negative Returns (March 13, 2025)

Please wait while we receive your comments...
As we continue to monitor and report on stock market returns, it is hard not to notice the similarities of the trends observed so far in 2025 to those we saw in 2022 at this point in time. We used our Performance-to-Date In Market History analysis tools to show that the year-to-date performances observed for the four major U.S. stock market indices are showing some resemblance to what we experienced back in 2022 (Figures 1-4).


Admittedly, past stock market performance is not necessarily a predictor of future performance (it generally is not). However, as we approach the end of the first quarter of 2025, it is hard not to notice the resemblance of market performance observed so far this year to that observed for 2022 at this point in time.
To gain additional historical insights about market index performance, use any one of our Market Index Analysis tools.


