Novembre 2026 has been a tough month for the S&P 500 index, and hence for all investors who have significant exposure to funds that track this index. We used our Performance-to-Date in Market History analysis tool to examine the month-to-date performance of the S&P 500 index (to November 20). The S&P 500 index has lost 8.84% of its value since the start of November. In fact, if we look all the way back to 1928, only four other times has the month-to-date (November 1 through 20) performance been worse than that of November 2026 (1929, 1937, 1973, and 2008). This sharp recent decline has brought the year-to-date performance to +0.95% for 2026.
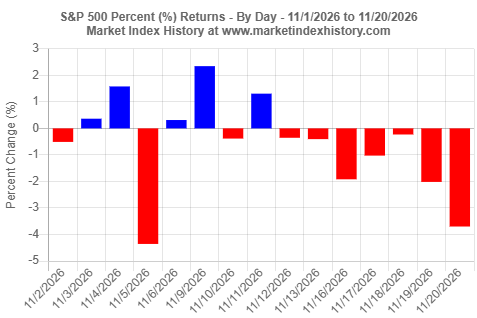
If we look at the November 2026 daily performance of the S&P 500 index, it becomes readily clear that 10 of the 15 November sessions have been negative. The last 7 sessions have all been negative (November 12 through 20) (Figure 1).
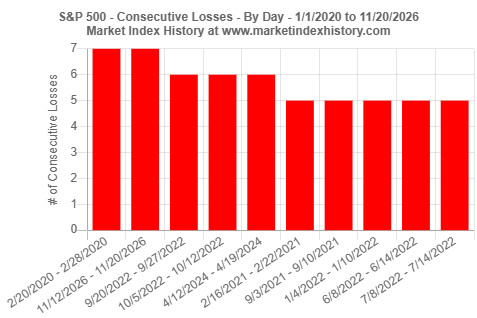
How far back do we need to look to see another instance of 7 consecutive negative sessions? To answer this question, we used our Consecutive Gains and Losses in Market History analysis tool. Figure 2 shows that a similar observation was made early in the 2020 COVID-19 pandemic.
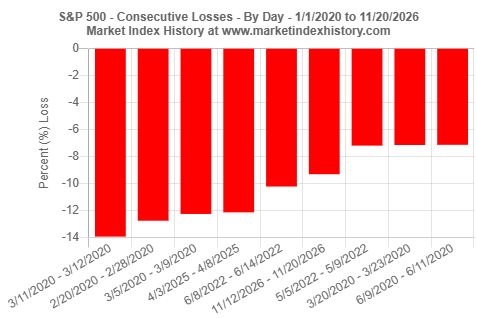
The cumulative decline during the 7-session stretch from November 12 through November 20 was –9.31%. If we look at data since 1/1/2020, we find that larger consecutive declines were observed in 2020, 2022, and 2025 (Figure 3).
There Is Good News for Long-Term Investors
While the rapid declines of the last few days have been painful and scary for investors, it is always important to maintain a long-term view of the US stock market and the incredible gains it has produced over long periods of time. With this long-term view in mind, history shows that long-term investors should stay the course and ignore short-term bouts of volatility.
For example, if we take a 30-year window and analyze data going back to 1995, we see that there were 6 instances of 7-day consecutive session losses (1996, 2008, 2 in 2011, 2016, and 2020), excluding the one just observed in 2026. In all 6 cases, there was a bounce within 1 to 3 days to levels higher than the low of the 7-day decline. In 3 cases, it took merely 5 to 9 sessions to regain the entire loss caused by the 7-day decline. In the depth of the last financial crisis in 2008, it took 364 sessions to regain the entire loss caused by the 7-day decline. The average recovery for all 6 instances was 106 sessions (about 5 months).
The data above show clearly that long-term investors should continue their monthly contributions to their investment portfolio. Contributions during the recovery period lower your overall dollar-cost average and lead to significantly greater gains when the S&P 500 index regains and exceeds its previous high levels.
Additional Market Index Analyses
To gain additional historical insights about market index performance, use any one of our Market Index Analysis tools. We use these analysis tools ourselves to gain insights into market performance and to highlight a variety of interesting observations in our historical insights articles.