Navigation Menu Search Market Index History Search Market Index History
   

U.S. Market Indices Show Very Large Intraday Fluctuations - April 7, 2025


Monday, April 7, 2025

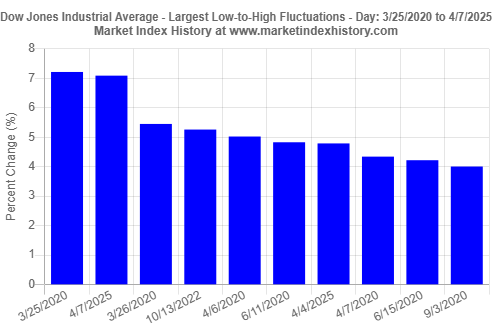
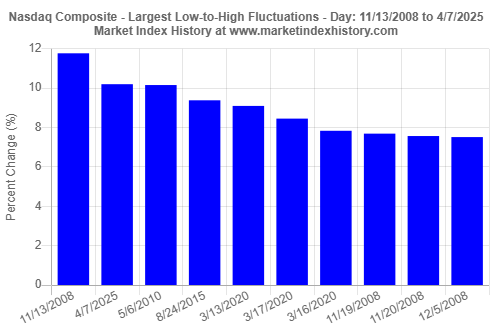
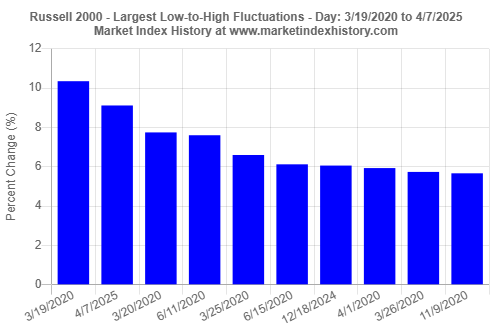
In the last few weeks, we have reported on many record-level market performances, most of which have entailed downward market movements. Today, the markets recorded very large intraday fluctuations. Each of the four major U.S. market indices exhibited a very large difference between its lowest and highest levels recorded during the trading session. The intraday fluctuation was 8.51% for the S&P 500 index (largest since 3/13/2020), 7.09% for the Dow Jones Industrial Average (largest since 3/25/2020), 10.20% for the Nasdaq Composite index (largest since 11/13/2008), and 9.12% for the Russell 2000 index (largest since 3/19/2020). We used our Largest Fluctuations in Market History analysis tool to prepare four charts to show these market changes.

Please wait. Market index history analysis is in progress...
Please wait while we receive your comments...

Go to S&P 500 Index chart
Go to Dow Jones Industrial Average chart
Go to Nasdaq Composite Index chart
Go to Russell 2000 Index chart


S&P 500 Index
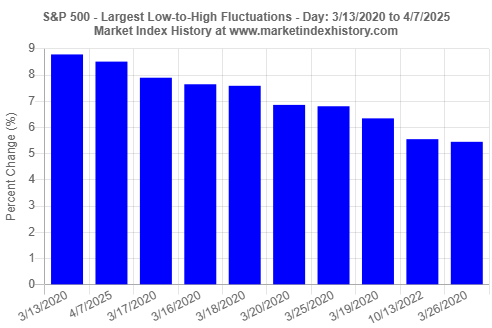
Top 10 largest intraday low-to-high percentage changes are shown for the S&P 500 index from 3/13/2020 to 4/7/2025
Figure 1. Top 10 largest intraday low-to-high percentage changes are shown for the S&P 500 index from 3/13/2020 to 4/7/2025. The values shown represent low-to-high percentage changes, where the low value is the lowest recorded value during the day, and the high value is the highest recorded value during the day. The intraday fluctuation recorded for the S&P 500 index on 4/7/2025 is the largest since 3/13/2020. See this analysis tool.


Dow Jones Industrial Average

Top 10 largest intraday low-to-high percentage changes are shown for the Dow Jones Industrial Average from 3/25/2020 to 4/7/2025
Figure 2. Top 10 largest intraday low-to-high percentage changes are shown for the Dow Jones Industrial Average from 3/25/2020 to 4/7/2025. The values shown represent low-to-high percentage changes, where the low value is the lowest recorded value during the day, and the high value is the highest recorded value during the day. The intraday fluctuation recorded for the Dow Jones Industrial Average on 4/7/2025 is the largest since 3/25/2008. See this analysis tool.


Nasdaq Composite Index

Top 10 largest intraday low-to-high percentage changes are shown for the Nasdaq Composite index from 11/13/2008 to 4/7/2025
Figure 3. Top 10 largest intraday low-to-high percentage changes are shown for the Nasdaq Composite index from 11/13/2008 to 4/7/2025. The values shown represent low-to-high percentage changes, where the low value is the lowest recorded value during the day, and the high value is the highest recorded value during the day. The intraday fluctuation recorded for the Nasdaq Composite index on 4/7/2025 is the largest since 11/13/2008. See this analysis tool.


Russell 2000 Index

Top 10 largest intraday low-to-high percentage changes are shown for the Russell 2000 index from 3/19/2020 to 4/7/2025
Figure 4. Top 10 largest intraday low-to-high percentage changes are shown for the Russell 2000 index from 3/19/2020 to 4/7/2025. The values shown represent low-to-high percentage changes, where the low value is the lowest recorded value during the day, and the high value is the highest recorded value during the day. The intraday fluctuation recorded for the Russell 2000 index on 4/7/2025 is the largest since 3/19/2020. See this analysis tool.

To gain additional historical insights about market index performance, use any one of our Market Index Analysis tools.


— share —
Share on Facebook    Share on X    Share on LinkedIn    Share on Pinterest    Share on Reddit    Email    Copy URL