Navigation Menu Search Market Index History Search Market Index History
   

Stock Market Wealth Evaporation Continues with Year-to-Date Losses in the Trillions - April 4, 2025


Friday, April 4, 2025

We have now completed two trading sessions following the announcement of new and broad tariffs placed on U.S. trading partners. In the last two days, institutional and retail investors have reacted very strongly to these tariffs, rapidly accelerating the market sell-off that started several weeks ago in anticipation of a market shake-up, and adding significantly to year-to-date market losses. All four major U.S. market indices were down significantly today, adding to already big losses incurred yesterday. Single-day losses, consecutive two-day losses, single-week losses, and year-to-date losses for all four market indices are similar to the large losses we experienced early in the COVID-19 pandemic in 2020. Year-to-date in 2025, the U.S. markets have shed trillions of dollars. For each market index, we have prepared six (6) charts that show these extraordinary observations.

Please wait. Market index history analysis is in progress...
Please wait while we receive your comments...

Go to S&P 500 Index charts
Go to Dow Jones Industrial Average charts
Go to Nasdaq Composite Index charts
Go to Russell 2000 Index charts


S&P 500 Index

Daily percent (%) returns of the S&P 500 index from the start of 2025 to 4/4/2025
Figure 1. Daily percent (%) returns of the S&P 500 index from the start of 2025 to 4/4/2025. The large losses on 4/3/2025 and 4/4/2025 were 4.84% and 5.98%, respectively. See this analysis tool.

The S&P 500 index losses on 4/4/2025 and 4/3/2025 are the second and fifth, respectively, largest single-day losses since 3/16/2020.
Figure 2. The S&P 500 index losses on 4/4/2025 and 4/3/2025 are the second and fifth, respectively, largest single-day losses since 3/16/2020. See this analysis tool.

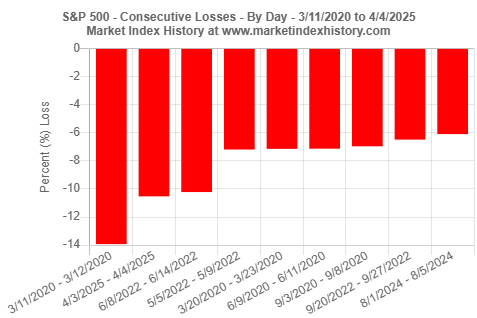
Consecutive daily losses of the S&P 500 index on 4/3/2025 and 4/4/2025 (-10.53% over two consecutive days) represent the largest consecutive losses since 3/11/2020 and 3/12/2020.
Figure 3. Consecutive daily losses of the S&P 500 index on 4/3/2025 and 4/4/2025 (-10.53% over two consecutive days) represent the largest consecutive losses since 3/11/2020 and 3/12/2020. See this analysis tool.

Weekly percent (%) returns of the S&P 500 index from the start of 2025 to 4/4/2025
Figure 4. Weekly percent (%) returns of the S&P 500 index from the start of 2025 to 4/4/2025. The large loss for trading week that ended on 4/4/2025 was 9.08%. See this analysis tool.

The S&P 500 index loss for trading week that ended on 4/4/2025 is the second largest single-week loss since the week ending on 3/20/2020.
Figure 5. The S&P 500 index loss for trading week that ended on 4/4/2025 is the second largest single-week loss since the week ending on 3/20/2020. See this analysis tool.

Year-to-date (to April 4) percent (%) returns of the S&P 500 index from 2015 to 2025
Figure 6. Year-to-date (to April 4) percent (%) returns of the S&P 500 index from 2015 to 2025. As of Friday, April 4, 2025, the S&P 500 index is down 13.73% for the year. See this analysis tool.


Dow Jones Industrial Average
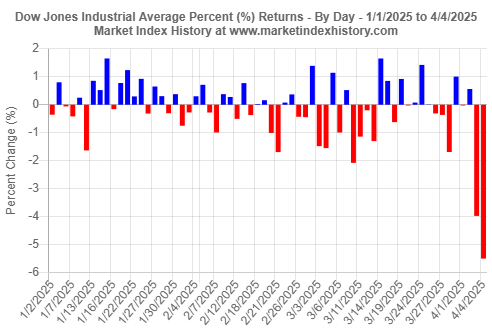
Daily percent (%) returns of the Dow Jones Industrial Average from the start of 2025 to 4/4/2025
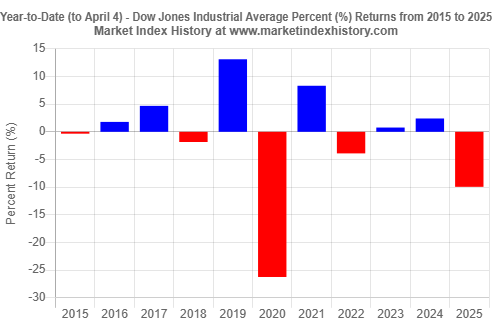
Figure 7. Daily percent (%) returns of the Dow Jones Industrial Average from the start of 2025 to 4/4/2025. The large losses on 4/3/2025 and 4/4/2025 were 3.98% and 5.50%, respectively. See this analysis tool.

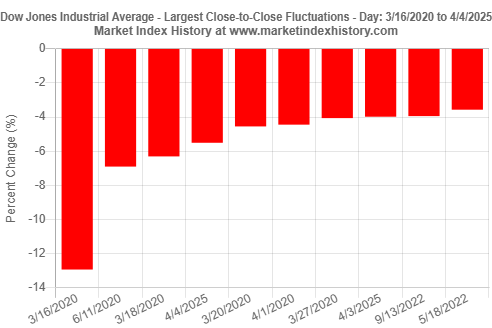
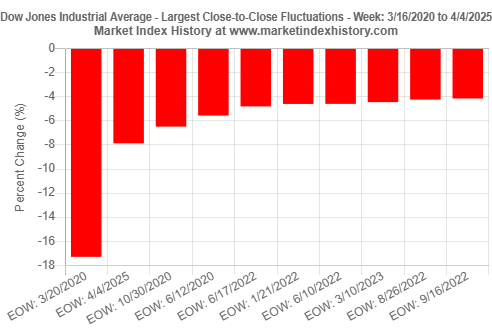
The Dow Jones Industrial Average losses on 4/4/2025 and 4/3/2025 are the fourth and eighth, respectively, largest single-day losses since 3/16/2020.
Figure 8. The Dow Jones Industrial Average losses on 4/4/2025 and 4/3/2025 are the fourth and eighth, respectively, largest single-day losses since 3/16/2020. See this analysis tool.

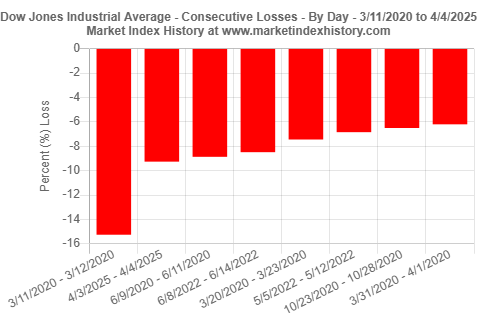
Consecutive daily losses of the Dow Jones Industrial Average on 4/3/2025 and 4/4/2025 (-9.26% over two consecutive days) represent the largest consecutive losses since 3/11/2020 and 3/12/2020.
Figure 9. Consecutive daily losses of the Dow Jones Industrial Average on 4/3/2025 and 4/4/2025 (-9.26% over two consecutive days) represent the largest consecutive losses since 3/11/2020 and 3/12/2020. See this analysis tool.

Weekly percent (%) returns of the Dow Jones Industrial Average from the start of 2025 to 4/4/2025
Figure 10. Weekly percent (%) returns of the Dow Jones Industrial Average from the start of 2025 to 4/4/2025. The large loss for trading week that ended on 4/4/2025 was 7.86%. See this analysis tool.

The Dow Jones Industrial Average loss for trading week that ended on 4/4/2025 is the second largest single-week loss since the week ending on 3/20/2020.
Figure 11. The Dow Jones Industrial Average loss for trading week that ended on 4/4/2025 is the second largest single-week loss since the week ending on 3/20/2020. See this analysis tool.

Year-to-date (to April 4) percent (%) returns of the Dow Jones Industrial Average from 2015 to 2025
Figure 12. Year-to-date (to April 4) percent (%) returns of the Dow Jones Industrial Average from 2015 to 2025. As of Friday, April 4, 2025, the Dow Jones Industrial Average is down 9.94% for the year. See this analysis tool.


Nasdaq Composite Index

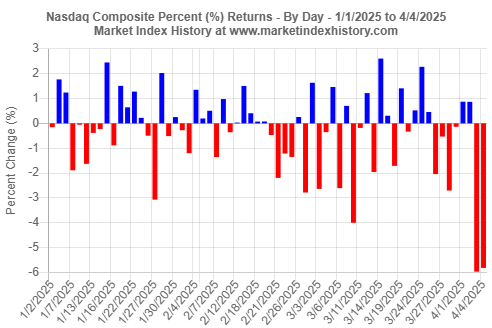
Daily percent (%) returns of the Nasdaq Composite index from the start of 2025 to 4/4/2025
Figure 13. Daily percent (%) returns of the Nasdaq Composite index from the start of 2025 to 4/4/2025. The large losses on 4/3/2025 and 4/4/2025 were 5.97% and 5.82%, respectively. See this analysis tool.

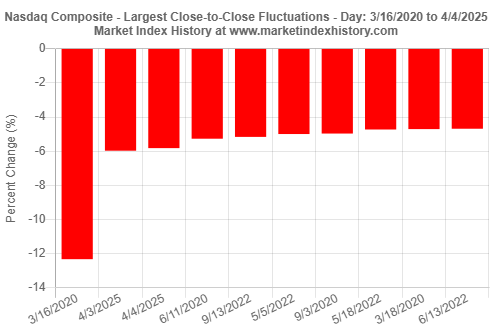
The Nasdaq Composite index losses on 4/3/2025 and 4/4/2025 are the second and third, respectively, largest single-day losses since 3/16/2020.
Figure 14. The Nasdaq Composite index losses on 4/3/2025 and 4/4/2025 are the second and third, respectively, largest single-day losses since 3/16/2020. See this analysis tool.

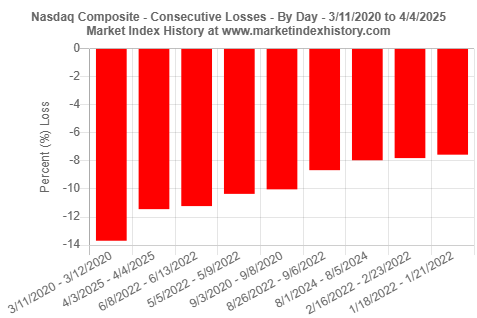
Consecutive daily losses of the Nasdaq Composite index on 4/3/2025 and 4/4/2025 (-11.44% over two consecutive days) represent the largest consecutive losses since 3/11/2020 and 3/12/2020.
Figure 15. Consecutive daily losses of the Nasdaq Composite index on 4/3/2025 and 4/4/2025 (-11.44% over two consecutive days) represent the largest consecutive losses since 3/11/2020 and 3/12/2020. See this analysis tool.

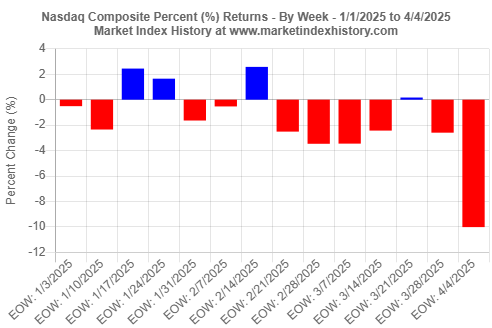
Weekly percent (%) returns of the Nasdaq Composite index from the start of 2025 to 4/4/2025
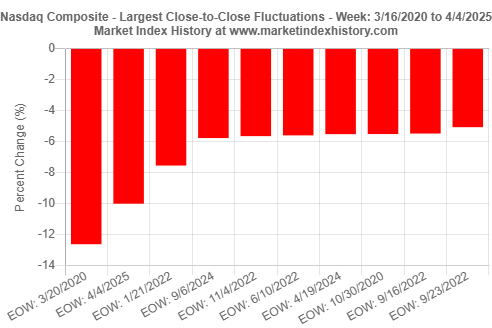
Figure 16. Weekly percent (%) returns of the Nasdaq Composite index from the start of 2025 to 4/4/2025. The large loss for trading week that ended on 4/4/2025 was 10.02%. See this analysis tool.

The Nasdaq Composite index loss for trading week that ended on 4/4/2025 is the second largest single-week loss since the week ending on 3/20/2020.
Figure 17. The Nasdaq Composite index loss for trading week that ended on 4/4/2025 is the second largest single-week loss since the week ending on 3/20/2020. See this analysis tool.

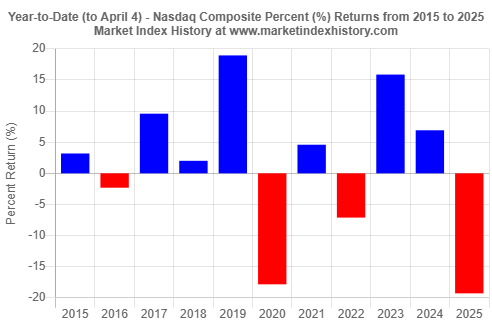
Year-to-date (to April 4) percent (%) returns of the Nasdaq Composite index from 2015 to 2025
Figure 18. Year-to-date (to April 4) percent (%) returns of the Nasdaq Composite index from 2015 to 2025. As of Friday, April 4, 2025, the Nasdaq Composite index is down 19.28% for the year. See this analysis tool.


Russell 2000 Index

Daily percent (%) returns of the Russell 2000 index from the start of 2025 to 4/4/2025
Figure 19. Daily percent (%) returns of the Russell 2000 index from the start of 2025 to 4/4/2025. The large losses on 4/3/2025 and 4/4/2025 were 6.59% and 4.37%, respectively. See this analysis tool.

The Russell 2000 index losses on 4/3/2025 and 4/4/2025 are the fifth and ninth, respectively, largest single-day losses since 3/16/2020.
Figure 20. The Russell 2000 index losses on 4/3/2025 and 4/4/2025 are the fifth and ninth, respectively, largest single-day losses since 3/16/2020. See this analysis tool.

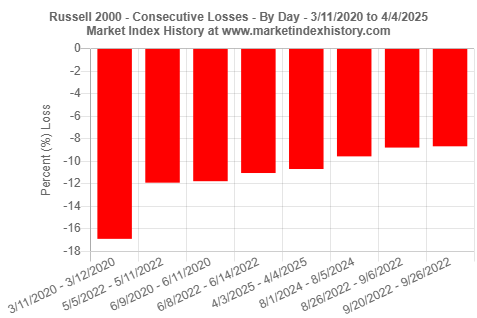
Consecutive daily losses of the Russell 2000 index on 4/3/2025 and 4/4/2025 (-11.89% over two consecutive days) represent the fifth largest consecutive losses since 3/11/2020 and 3/12/2020.
Figure 21. Consecutive daily losses of the Russell 2000 index on 4/3/2025 and 4/4/2025 (-11.89% over two consecutive days) represent the fifth largest consecutive losses since 3/11/2020 and 3/12/2020. See this analysis tool.

Weekly percent (%) returns of the Russell 2000 index from the start of 2025 to 4/4/2025
Figure 22. Weekly percent (%) returns of the Russell 2000 index from the start of 2025 to 4/4/2025. The large loss for trading week that ended on 4/4/2025 was 9.70%. See this analysis tool.

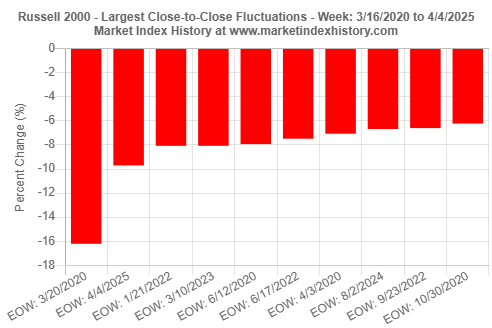
The Russell 2000 index loss for trading week that ended on 4/4/2025 is the second largest single-week loss since the week ending on 3/20/2020.
Figure 23. The Russell 2000 index loss for trading week that ended on 4/4/2025 is the second largest single-week loss since the week ending on 3/20/2020. See this analysis tool.

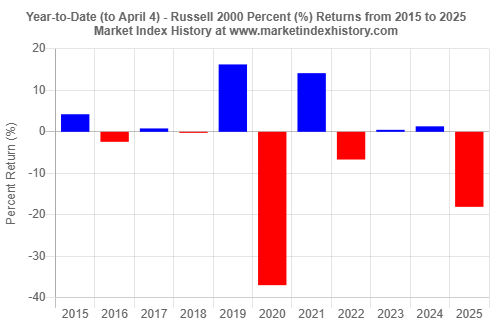
Year-to-date (to April 4) percent (%) returns of the Russell 2000 index from 2015 to 2025
Figure 24. Year-to-date (to April 4) percent (%) returns of the Russell 2000 index from 2015 to 2025. As of Friday, April 4, 2025, the Russell 2000 index is down 18.08% for the year. See this analysis tool.

To gain additional historical insights about market index performance, use any one of our Market Index Analysis tools.


— share —
Share on Facebook    Share on X    Share on LinkedIn    Share on Pinterest    Share on Reddit    Email    Copy URL