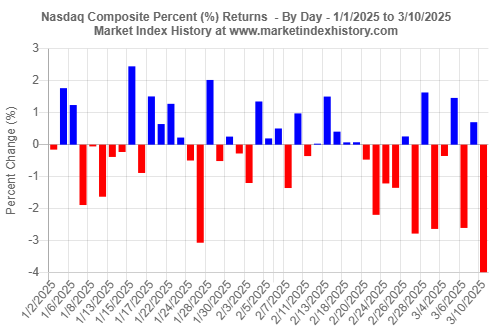
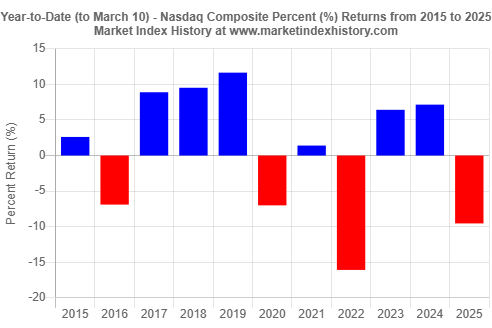
The Nasdaq Composite Index dropped 4.0% on Monday, March 10, 2025, bringing its total year-do-date loss to 9.5%. We used our Market Index Performance and Performance-to-Date In Market History analysis tools to prepare two charts that clearly summarize how the Nasdaq Composite index has performed so far in 2025.


So Far in 2025, It Is Looking Tough for the Nasdaq Composite Index (March 10, 2025)

Please wait while we receive your comments...
Figure 1 shows the daily percent (%) returns of the Nasdaq Composite index from the start of 2025 to March 10. The 4.0% loss today (Monday, March 10, 2025) is the largest single-day loss this year and, indeed, it is the largest single-day loss since September 13, 2022 (see our Largest Fluctuations in Market History analysis tool).

Figure 2 shows the year-to-date performance of the Nasdaq Composite index (to March 10) from 2015 to 2025. Looking at historical data back to 2000, we do not find any historical evidence that year-to-date market performance to March 10 is a good predictor of performance for the entire year.

Monday, March 10, 2025


