All four major U.S. market indices exhibited large single-week declines for the trading week ending on Friday, March 7, 2025. The S&P 500 was down 3.1% for the week, the Dow Jones Industrial Average was down 2.4%, the Nasdaq Composite was down 3.5%, and the Russell 2000 was down 4.0%. The single-week loss for the S&P 500 index was the largest since the trading week ending on September 6, 2024. These losses continue the downward trends in 2025, with the S&P 500, Nasdaq Composite, and Russell 2000 showing three (3) consecutive weeks of losses, amounting to among the largest consecutive losses since 2022.


Large Single-Week Declines for Major U.S. Market Indices (March 7, 2025)

Please wait while we receive your comments...
Large Single-Week Declines for All Major U.S. Market Indices
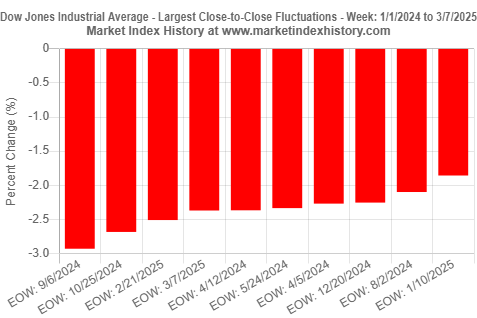
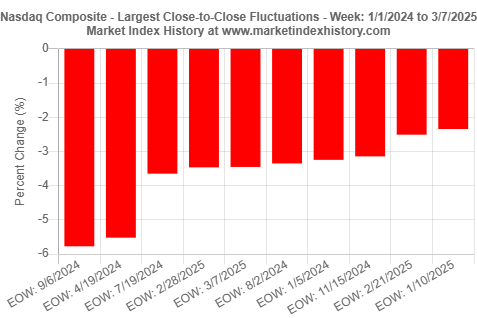
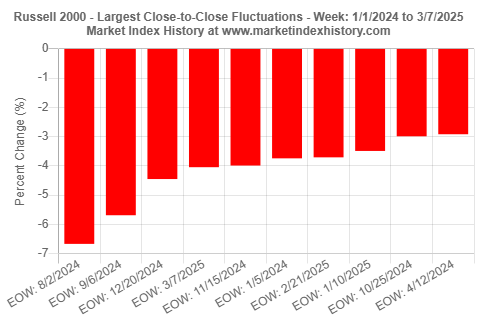
The trading week ending on Friday, March 7, 2025 showed another week of losses, adding to losses already incurred in 2025. As always, here at Market Index History, our goal is to gain a larger perspective of market performance by comparing the latest observations against market performance over a longer time period. We used our Largest Fluctuations in Market History analysis tool to place this week's losses in a recent historical context. Figures 1-4 summarize this week's losses, providing comparisons with the largest single-week losses since 1/1/2024.
The S&P 500 index loss today was the 2nd largest single-week loss since the trading week ending on 9/6/2024 (Figure 1). The Dow Jones Industrial Average loss was the 4th largest single-week loss since 1/1/2024 (Figure 2). The Nasdaq Composite loss was the 5th largest single-week loss since 1/1/2024 (Figure 3). The Russell 2000 loss was the 4th largest single-week loss since 1/1/2024 (Figure 4).

Three (3) Consecutive Weeks of Losses for S&P 500, Nasdaq Composite, and Russell 2000
We used our Market Index Performance analysis tool to show weekly market index performance since the start of 2025 (Figures 5-8). A quick examination of Figures 5 through 8 reveals that the S&P 500, Nasdaq Composite, and Russell 2000 have now had three (3) consecutive weeks of losses.


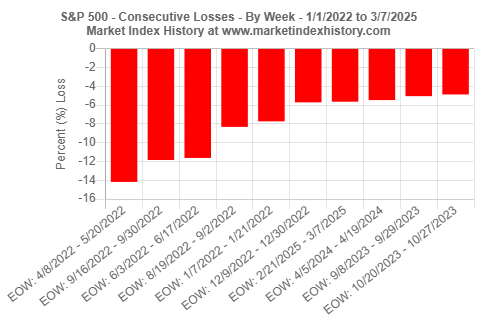
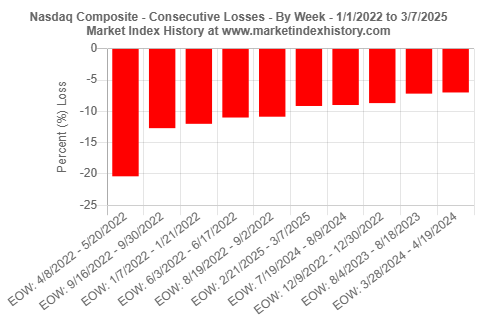
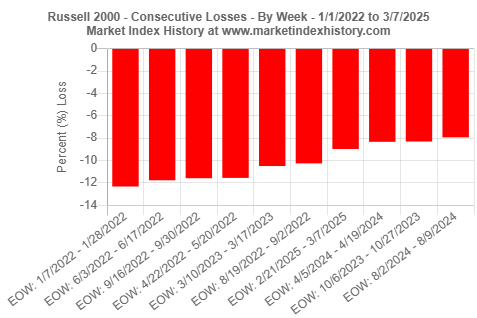
We then used our Consecutive Gains and Losses in Market History analysis tool to gain a deeper and historical understanding of these recent losses (Figures 9-11). This analysis tool allows us to see both the longest-running gains and losses, as well as the largest consecutive gains and losses during any specified time period. For the purpose of this analysis, we are showing the largest consecutive losses. Since, 2022 was a particularly tough year for the U.S. markets with declines exhibited by all four major indices, we used 2022 as the start of this analysis and extending until the close of the most recent market session (March 7, 2025).
The recent 3-week consecutive losses exhibited by the S&P 500 index (-5.6%) is the 7th largest consecutive loss since 1/1/2022. For the Nasdaq Composite index, the recent consecutive loss of 9.1% is the 6th largest since 2022. For the Russell 2000 index, the recent consecutive loss of 9.0% is the 7th largest since 2022.
To gain additional historical insights about market index performance, use any one of our Market Index Analysis tools.


