As we closed the month of March, we used our publicly available analysis tools to place the performance of the Dow Jones Industrial Average within a historical context of market performance. In particular, we wished to better understand how Dow Jones Industrial Average performance in March 2025 compared to performance in March of previous years. Moreover, since the end of March is also the end of the first quarter (Q1), we conducted similar analyses to better understand the performance of the Dow Jones Industrial Average in 2025 Q1 and its place in market history.
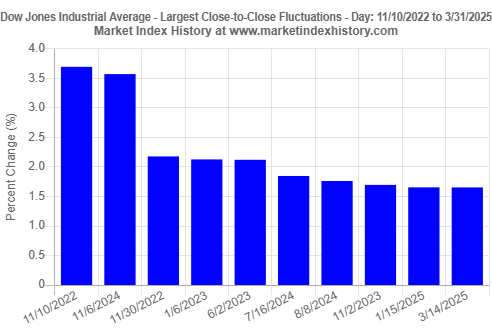
We start with a look at the Dow Jones Industrial Average daily returns in March 2025. Several large single-day gains and losses were observed during the month (Figure 1). The largest single-day gain recorded in March 2025 (+1.65% on 3/14/2025) is the tenth largest single-day gain recorded since November 2022 (Figure 2). The largest single-day loss recorded in March 2025 (-2.08% on 3/10/2025) is the sixth largest single-day loss recorded since September 2022 (Figure 3).
Historically and on average, the Dow Jones Industrial Average has shown positive returns in March. Figure 4 shows average monthly (January to December) returns from January 1995 to March 2025. Based on this 31-year dataset, the Dow Jones Industrial Average has exhibited an average return of +0.92% in March.
To delve deeper into the analysis shown in Figure 4 with a focus on the month of March, we examined the Dow Jones Industrial Average performance for every March from 1995 to 2025 (Figure 5). In March 2025, the Dow Jones Industrial Average had a loss of 4.20%. As shown in Figure 5, this is the worst March performance since March 2020, and the third worst March performance since March 2001.
We then looked at monthly returns of the Dow Jones Industrial Average from December 2022 to March 2025 (Figure 6). Figure 6 shows that March 2025 performance is the worst performance for any month since December 2022.
Since the end of March is also the end of the first quarter (Q1), we took a look at Q1 performance in 2025 in comparison to previous quarters (Figure 7). The Dow Jones Industrial Average showed 1.28% reduction in value in Q1 of 2025. Figure 7 shows that Q1 of 2025 was the worst first quarter since Q1 of 2022, and the worst performance for any quarter since Q2 of 2024.
To gain additional historical insights about market index performance, use any one of our Market Index Analysis tools.


