Navigation Menu Search Market Index History Search Market Index History
   

Big Stock Market Pull-Back Signals Strong Investor Jitters – April 3, 2025


Thursday, April 3, 2025

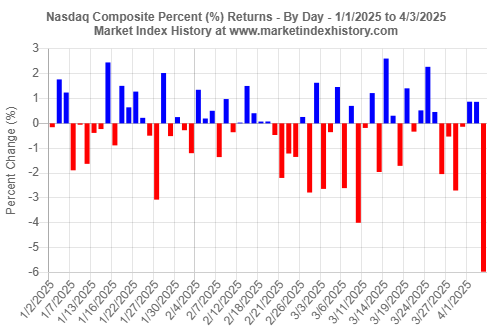
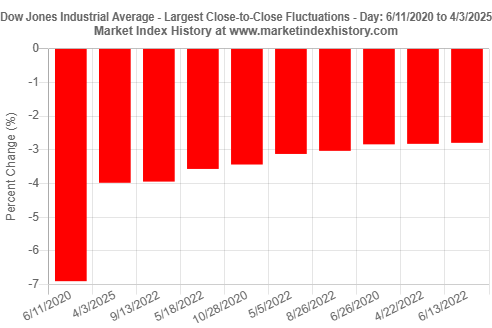
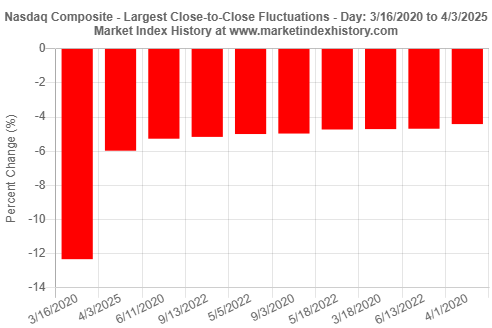
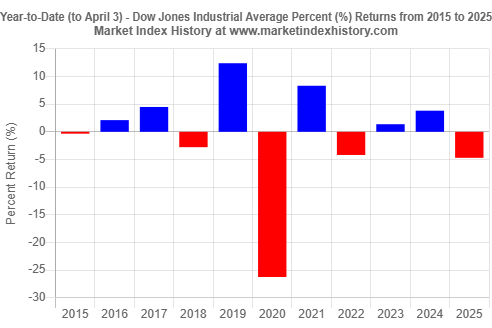
On Thursday, April 3, 2025, investors reacted strongly to new and broad tariffs placed on U.S. trade partners. All four major U.S. market indices were down significantly today. The S&P 500 lost 4.8%, Dow Jones Industrial Average gave back 4.0%, Nasdaq Composite index declined by 6.0%, and Russell 2000 index decreased by 6.6%. To find single-day losses of similar magnitudes, we will have to look back to the COVID-19 pandemic era of 2020. The losses today added to already growing losses for the year. Year-to-date, returns are -8.2% for the S&P 500, -4.7% for Dow Jones Industrial Average, -14.3% for Nasdaq Composite, and -14.3% for Russell 2000. We have prepared twelve (12) charts that show these market reactions.

Please wait. Market index history analysis is in progress...
Please wait while we receive your comments...

Daily percent (%) returns of the S&P 500 index from the start of 2025 to 4/3/2025
Figure 1. Daily percent (%) returns of the S&P 500 index from the start of 2025 to 4/3/2025. The loss on 4/3/2025 was 4.8%. See this analysis tool.

Daily percent (%) returns of the Dow Jones Industrial Average from the start of 2025 to 4/3/2025
Figure 2. Daily percent (%) returns of the Dow Jones Industrial Average from the start of 2025 to 4/3/2025. The loss on 4/3/2025 was 4.0%. See this analysis tool.

Daily percent (%) returns of the Nasdaq Composite index from the start of 2025 to 4/3/2025
Figure 3. Daily percent (%) returns of the Nasdaq Composite index from the start of 2025 to 4/3/2025. The loss on 4/3/2025 was 6.0%. See this analysis tool.

Daily percent (%) returns of the Russell 2000 index from the start of 2025 to 4/3/2025
Figure 4. Daily percent (%) returns of the Russell 2000 index from the start of 2025 to 4/3/2025. The loss on 4/3/2025 was 6.6%. See this analysis tool.

The S&P 500 index loss on 4/3/2025 is the second largest single-day loss since 6/11/2020.
Figure 5. The S&P 500 index loss on 4/3/2025 is the second largest single-day loss since 6/11/2020. See this analysis tool.

The Dow Jones Industrial Average loss on 4/3/2025 is the second largest single-day loss since 6/11/2020.
Figure 6. The Dow Jones Industrial Average loss on 4/3/2025 is the second largest single-day loss since 6/11/2020. See this analysis tool.

The Nasdaq Composite index loss on 4/3/2025 is the second largest single-day loss since 3/16/2020.
Figure 7. The Nasdaq Composite index loss on 4/3/2025 is the second largest single-day loss since 3/16/2020. See this analysis tool.

The Russell 2000 index loss on 4/3/2025 is the second largest single-day loss since 6/11/2020.
Figure 8. The Russell 2000 index loss on 4/3/2025 is the second largest single-day loss since 6/11/2020. See this analysis tool.

Year-to-date (to April 3) percent (%) returns of the S&P 500 index from 2015 to 2025
Figure 9. Year-to-date (to April 3) percent (%) returns of the S&P 500 index from 2015 to 2025. As of Thursday, April 3, 2025, the S&P 500 index is down 8.2% for the year. See this analysis tool.

Year-to-date (to April 3) percent (%) returns of the Dow Jones Industrial Averag from 2015 to 2025
Figure 10. Year-to-date (to April 3) percent (%) returns of the Dow Jones Industrial Average from 2015 to 2025. As of Thursday, April 3, 2025, the Dow Jones Industrial Average is down 4.7% for the year. See this analysis tool.

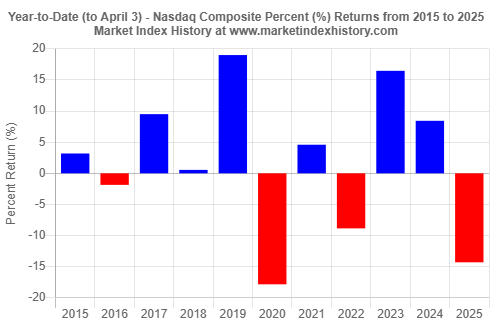
Year-to-date (to April 3) percent (%) returns of the Nasdaq Composite index from 2015 to 2025
Figure 11. Year-to-date (to April 3) percent (%) returns of the Nasdaq Composite index from 2015 to 2025. As of Thursday, April 3, 2025, the Nasdaq Composite index is down 14.3% for the year. See this analysis tool.

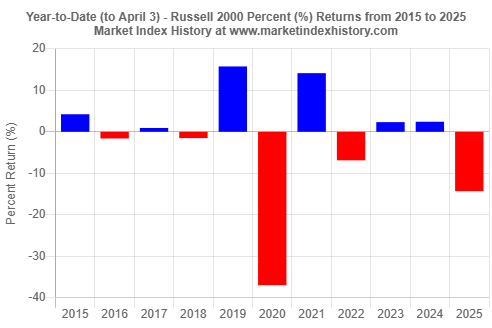
Year-to-date (to April 3) percent (%) returns of the Russell 2000 index from 2015 to 2025
Figure 12. Year-to-date (to April 3) percent (%) returns of the Russell 2000 index from 2015 to 2025. As of Thursday, April 3, 2025, the Russell 2000 index is down 14.3% for the year. See this analysis tool.

To gain additional historical insights about market index performance, use any one of our Market Index Analysis tools.


— share —
Share on Facebook    Share on X    Share on LinkedIn    Share on Pinterest    Share on Reddit    Email    Copy URL