The U.S. stock markets had a beautiful rally on Friday, March 14, 2025, with all four major market indices gaining significantly. The S&P 500 index rose 2.1%, Dow Jones Industrial Average gained 1.7%, Nasdaq Composite index increased 2.6%, and the Russell 2000 index grew 2.5%. However, these large single-day gains were not enough to put a stop to four consecutive weeks of losses exhibited by the S&P 500 index (-7.8%), Nasdaq Composite index (-11.3%), and Russell 2000 index (-10.3%), and two consecutive weeks of losses for the Dow Jones Industrial Average (-5.4%). We have to go back to September of 2022 to see consecutive losses of these magnitudes.


Beautiful End-of-Week Market Rally Was Not Enough to Break Several Consecutive Weeks of Losses (Friday, March 14, 2025)

Please wait while we receive your comments...
The U.S. stock markets gained significantly on Friday, March 14, 2025 with investors showing renewed confidence in all market sectors. These single-day gains were indeed a welcome relief as they reversed some, but not all, of the losses exhibited earlier in the week. We used our Market Index Performance analysis tool to examine the weekly percent (%) returns of the four major U.S. market indices since the start of 2025 (Figures 1-4).
Looking at Figures 1-4, it is hard not to notice four (4) weeks of consecutive losses for the S&P 500 index, Nasdaq Composite index, and Russell 2000 index. Dow Jones Industrial Average has had two (2) weeks of consecutive losses. These weeks-long consecutive losses have led to significant declines in market value: -7.8 % for S&P 500 index, -5.4% for Dow Jones Industrial Average, -11.3% for Nasdaq Composite index, and -10.3% for Russell 2000 index.


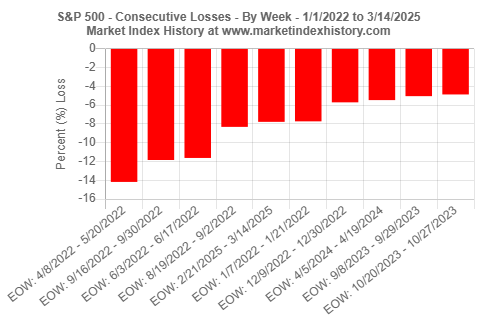
Earlier this week, we likened the 2025 year-to-date market losses to those that occurred in 2022, a year that had negative returns for all four U.S. major market indices. Indeed, to see consecutive market losses of similar magnitudes, we need to extend our analysis back to September 2022. As a representative example, we show the result of our analysis for the S&P 500 index in Figure 5. Feel free to use our Consecutive Gains and Losses in Market History analysis tool to note similar observations for other market indices.

To gain additional historical insights about market index performance, use any one of our Market Index Analysis tools.


